You check your revenue dashboard every morning. Maybe you track conversion rate and average order value. But ask most e-commerce founders about contribution margin by SKU or inventory turnover velocity, and you'll get blank stares.
The Hard Truth: Revenue is a vanity metric. You can grow revenue while destroying your business—just discount aggressively and ignore unit economics. The metrics that predict sustainable growth are the ones hiding in your data.
1. Contribution Margin by SKU
Contribution margin is revenue minus variable costs (product cost, shipping, payment processing, returns). It's the dollars each product contributes to covering fixed costs and generating profit.
Most e-commerce founders know their blended contribution margin. But they don't know it by SKU—and that's where the insights hide.
Real Example: A skincare brand discovered their bestselling moisturizer had a 15% contribution margin while a slower-selling serum had 60% margin. They tripled ad spend on the serum and increased profitability by 40% with the same revenue.
Why it matters: You might be spending acquisition dollars on products that lose money after all costs. Or ignoring high-margin products because they don't sell volume.
How to calculate: (Revenue - COGS - Shipping - Payment Processing - Returns) / Revenue, calculated at the SKU level, not blended.
Action: Rank your products by contribution margin dollars (not percentage). The top 20% of SKUs by contribution margin are your growth engines. Double down there.
2. Customer Acquisition Cost by Channel
You know your blended CAC. But Facebook ads, Google Shopping, Instagram influencers, and TikTok all have wildly different CACs—and different customer LTVs.
The mistake: Treating all channels the same. A $50 CAC from Facebook might be terrible if those customers never return. But a $80 CAC from email might be incredible if they buy monthly.
Common Trap: Optimizing for the lowest CAC channel instead of the highest LTV:CAC ratio. You're leaving money on the table by avoiding "expensive" channels that acquire loyal customers.
How to track: Calculate CAC by tagging every order with its acquisition channel (use UTM parameters and a good attribution model). Then calculate LTV by cohort for each channel.
What good looks like: Your best channel should have a 3:1 or higher LTV:CAC ratio. If all your channels are below 2:1, you have a unit economics problem, not a marketing problem.
Pro insight: New customer CAC and returning customer "reactivation cost" are different metrics. Track them separately.
3. Repeat Purchase Rate (by Cohort)
What percentage of customers make a second purchase? Third purchase? This metric separates successful e-commerce brands from struggling ones.
But the aggregate number hides the story—you need to track it by acquisition cohort and by time period.
The cohort insight: Compare December 2024 cohort vs January 2025 cohort at 30 days. If January's repeat rate is lower, something changed—product quality, shipping times, or customer expectations.
Time-based analysis: Track repeat purchase at 30, 60, and 90 days. Some products (supplements) have natural 30-day cycles. Others (fashion) are seasonal. Know your rhythm.
Growth Lever: A 5% increase in repeat purchase rate is worth more than a 10% increase in new customer acquisition. Retention is cheaper than acquisition.
Action: If your 30-day repeat rate is below 20%, focus on retention before scaling acquisition. You're pouring water into a leaky bucket.
4. Return Rate by Product Category
Your blended return rate might be 8%. But one category might be 25% while another is 2%. Returns destroy margin and signal deeper problems.
Why returns matter more than you think:
• You've already paid acquisition costs
• You've paid shipping twice (to customer and back)
• You've paid payment processing fees (often non-refundable)
• The product might not be resellable
• Customer trust is damaged
A product with a 20% return rate needs 20% higher margin just to break even with a product with 5% returns.
Case Study: An apparel brand discovered their "true to size" claim was causing 30% returns on one product line. They updated the size guide and reduced returns to 12%—adding $180K to annual profit without selling one additional unit.
What to track:
• Return rate by SKU
• Return rate by category
• Return reasons (size, quality, didn't meet expectations)
• Time to return (early returns signal immediate disappointment)
Action: Any product above 15% return rate deserves investigation. Fix the product, fix the photography, or fix the description. High return rates are a tax on your business.
5. Inventory Turnover by SKU
Inventory sitting in your warehouse is cash that's not working for you. Inventory turnover measures how quickly you sell and replace inventory.
The formula: Cost of Goods Sold / Average Inventory Value. A turnover of 6 means you cycle through your entire inventory 6 times per year (every 2 months).
The SKU-level insight: Your blended turnover might be healthy, but 20% of SKUs might be turning once a year (dead inventory) while 20% turn monthly (stock-outs hurting growth).
Why it matters:
• Low turnover = cash locked in inventory that could fund growth
• High turnover = potential stock-outs and lost sales
• Seasonal products need different turnover targets
• Storage costs add up—slow inventory costs 20-30% of its value annually in storage and opportunity cost
Founder Mistake: Buying 6 months of inventory to get a bulk discount, then realizing that "savings" is costing you cash flow when you need it most.
Action: Identify SKUs with turnover below 4x annually. Either discount to clear, bundle with fast-movers, or discontinue. That cash can fund inventory of products that actually sell.
Putting It Together
These five metrics tell you everything revenue doesn't:
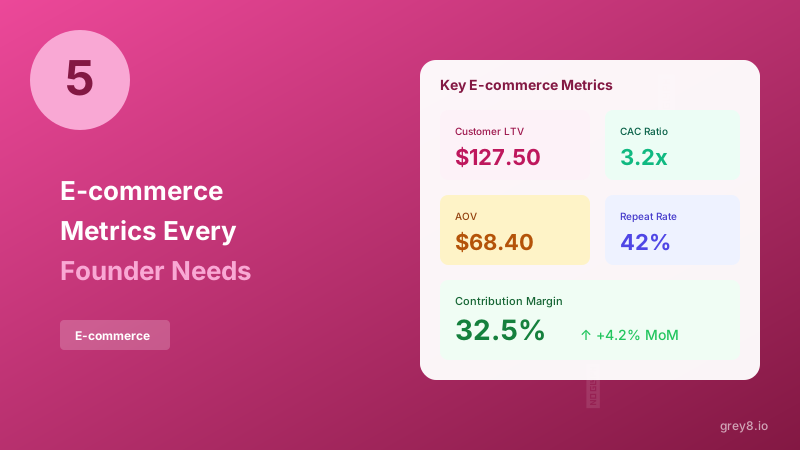
• Contribution margin by SKU tells you where to scale
• CAC by channel tells you where to spend
• Repeat purchase rate tells you if you have a real business or a marketing engine
• Return rate tells you where you're bleeding margin
• Inventory turnover tells you if your cash is working or sitting
Track these weekly, not monthly. E-commerce moves fast—by the time you see problems in monthly reports, you've already lost four weeks of optimization time.
The Compounding Effect: Improve each metric by 10% and you don't improve your business by 10%—you improve it by 60%+. These metrics multiply, they don't add.
Most e-commerce platforms don't calculate these metrics out of the box. You need to combine data from Shopify, your 3PL, ad platforms, and accounting. Or you need a tool that does it automatically.