Your Google Ads dashboard shows a 4:1 ROAS. Congratulations—you're probably still losing money. The metrics Google highlights are designed to make you spend more, not to help you profit more. Here are the five numbers that actually matter.
The Hard Truth: 67% of small businesses track ROAS but can't tell you their true profit per conversion. They're optimizing for revenue while bleeding margin.
1. True ROAS (Not Google's Version)
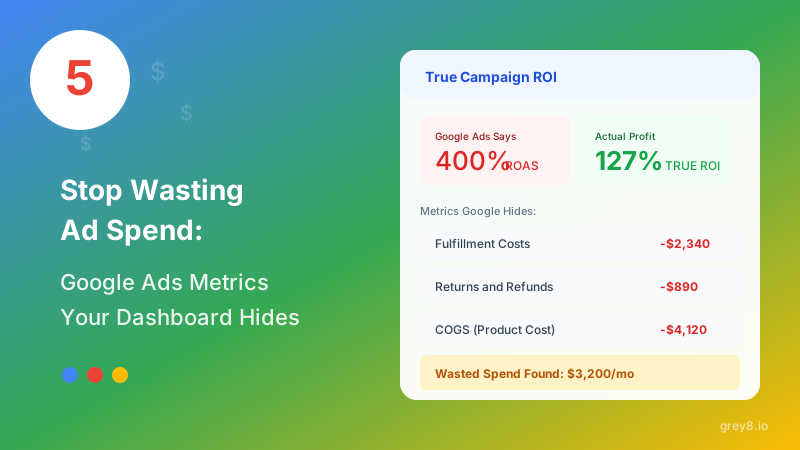
Google calculates ROAS as conversion value divided by ad spend. Sounds right—except it ignores product costs, fulfillment, payment processing, refunds, and everything else that determines if you actually made money.
A 4:1 ROAS on a 40% margin product means you're actually at 1.6:1 on profit. Below breakeven once you account for overhead. Grey8 connects your Google Ads data with your accounting system to show you profit-based ROAS in real-time.
2. Customer Quality Score
Not all conversions are created equal. A customer acquired from a branded search query typically has 3x higher lifetime value than one from a cold prospecting campaign. But Google Ads treats them identically in your conversion reports.
Grey8 Insight: We automatically segment conversions by quality—first-time vs repeat, high-intent vs exploratory, high-LTV vs one-time. You'll know which campaigns attract customers who stick.
Track repeat purchase rate, average order value, and 90-day retention by campaign. The campaign with the highest conversion rate might have the worst customer quality—and you'd never know from the Google Ads interface alone.
3. Incrementality Rate
Here's the question Google doesn't want you to ask: How many of these conversions would have happened anyway, even without the ad?
If you're bidding on your own brand name, you're paying for customers who were already coming to you. If you're retargeting cart abandoners who always come back, you're crediting ads for organic behavior.
The Test: Pause your brand campaigns for two weeks. Watch direct traffic. If it rises proportionally to your brand campaign decline, you were paying for traffic you already owned.
True incrementality requires holdout testing or geo-experiments—something most dashboards can't calculate. Grey8 uses statistical modeling to estimate incrementality across your campaigns, showing you which spend is actually driving new business versus claiming credit for existing demand.
4. Cross-Channel Cannibalization
Your Google Ads report shows 200 conversions this month. Your SEO traffic is down 50 conversions. Coincidence? Probably not.
Paid search cannibalizes organic search. Shopping ads cannibalize product listing pages. YouTube ads cannibalize organic social. Single-channel dashboards can't see this—but your blended CAC reveals the truth.
Grey8 tracks blended CAC across all your marketing channels, surfaces cannibalization patterns, and helps you understand the true marginal cost of acquisition—not just what each platform claims credit for.
5. Profit Per Click (Not CPC)
Everyone obsesses over lowering cost per click. But who cares about CPC if your clicks don't convert profitably?
A $5 CPC that converts at 10% with $200 profit per sale = $50 profit per click. A $0.50 CPC that converts at 1% with $50 profit per sale = $0.50 profit per click. The "expensive" click made you 100x more money.
The Shift: Stop optimizing for lower CPC. Start optimizing for higher profit per click. It's the only metric that directly correlates with growing your bank account.
This requires connecting conversion data with product margins and customer lifetime value—data Google doesn't have access to. Grey8 does, and calculates it automatically.
The Metrics That Actually Matter
Google Ads is an incredible platform—but its dashboards are designed to sell more ads, not to maximize your profitability. The metrics they highlight (impressions, clicks, conversions, ROAS) are important, but they're not sufficient.
To know if your ads are actually working, you need to see through Google's lens into your own books. That requires connecting ad platforms, analytics, e-commerce, and accounting data—and interpreting them together.
Grey8 does this automatically. Connect your Google Ads account alongside QuickBooks, Shopify, or Stripe, and see true profit-based ROAS, customer quality scores, incrementality, and cross-channel effects in one unified dashboard.
No more guessing. No more vanity metrics. Just the truth about what's making you money.