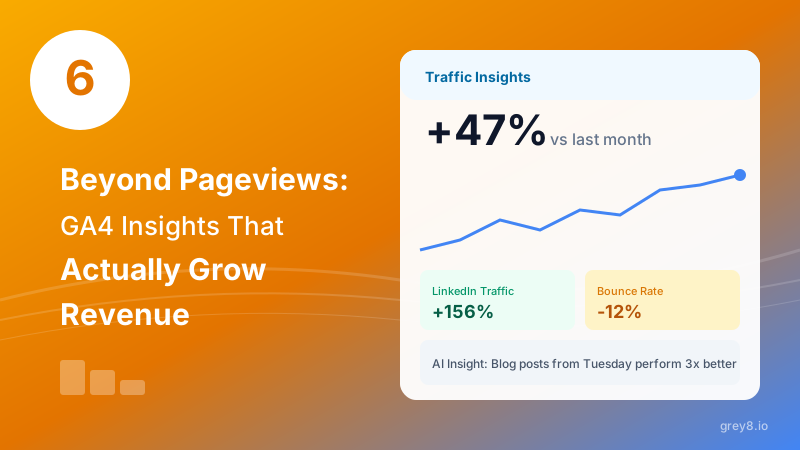
Google Analytics 4 is packed with data. But let's be honest: most businesses look at pageviews, bounce rates, and session duration—metrics that feel important but don't actually tell you what to do next. Meanwhile, the insights that predict revenue growth are buried three menus deep.
The GA4 Paradox: It's more powerful than Universal Analytics ever was—and somehow harder to use. 95% of users never touch the features that actually matter for revenue growth.
1. Engaged Sessions (Not Bounce Rate)
GA4 killed bounce rate. Good riddance. Engaged sessions are far more predictive of conversion—they measure users who spent 10+ seconds, viewed 2+ pages, or triggered a conversion event.
But here's what GA4 won't tell you: engaged session rate by traffic source, landing page, and device—combined. Grey8 automatically surfaces which source + page + device combinations drive real engagement vs. which ones waste ad spend.
2. User Acquisition Cost by Source/Medium
GA4 shows you where users come from. It doesn't show you what they cost or whether they're worth it. To calculate true acquisition cost per channel, you need to manually export GA4 data and combine it with ad platform spend.
Grey8 Advantage: Connect your ad platforms alongside GA4, and Grey8 automatically calculates cost-per-acquired-user and LTV:CAC by source, medium, and campaign. See which traffic sources actually pay for themselves.
Most businesses discover that 30-40% of their traffic sources have negative ROI once acquisition cost is factored in. GA4 shows you the traffic. Grey8 shows you which traffic is worth buying.
3. Scroll Depth by Page
Pageviews are a vanity metric. Scroll depth reveals whether users actually consume your content—or bounce after the headline. GA4 can track scroll events (if configured), but surfacing actionable insights requires custom reports.
Target: 50%+ of visitors should scroll past 75% on key pages (product, pricing, blog posts). Below 30%? Your content isn't engaging or your page load speed is killing you.
Pro Tip: High traffic + low scroll depth = wrong audience or misleading headline. Fix the source or the promise, not just the content.
4. Path Exploration (User Journey Analysis)
How do users actually move through your site? GA4's Exploration tool can show you—if you know how to build the right report (most don't). Path analysis reveals the actual conversion journey vs. the one you designed.
Common discoveries from path exploration:
- Users visiting pricing before features (your nav order is wrong)
- High drop-off after specific pages (content or UX issue)
- Unexpected conversion paths (reveals hidden opportunities)
Grey8 automatically visualizes the most common paths to conversion—and the most common paths to exit. No custom exploration required.
5. Cohort Retention Analysis
GA4 can build cohort reports showing user retention over time. But building meaningful cohorts (by acquisition source, first landing page, device type) requires technical know-how that most marketers don't have.
Hidden Truth: Not all traffic sources produce users who stick around. Organic search users typically return 2-3X more than paid social. But you'd never know without cohort analysis.
Target: 20%+ of new users should return within 7 days. Below 10%? You're attracting the wrong audience or failing to deliver post-visit value (email capture, retargeting, etc.).
6. Revenue Attribution (Beyond Last Click)
GA4's default attribution is "last click"—the final touchpoint gets all the credit. But real customer journeys involve multiple touchpoints. Data-driven attribution reveals which channels actually start and nurture conversions.
Example: A user discovers you via organic search, returns via direct traffic, and converts via paid search. Last-click gives all credit to paid search. Data-driven attribution shows the full story.
Most businesses over-invest in bottom-funnel channels (paid search, retargeting) and under-invest in top-funnel channels (content, organic social) because last-click attribution lies about what drives revenue.
From Data Overload to Actionable Insights
GA4 gives you all the data. Grey8 gives you the answers. These six insights predict revenue growth—but extracting them from GA4 requires custom reports, BigQuery exports, and a data analyst on retainer.
Or you could connect Grey8 and see all six metrics update in real-time, with automatic anomaly detection and plain-English recommendations.
Pageviews are easy to understand. Revenue growth requires going deeper. Grey8 makes that easy too.