Your Shopify dashboard celebrates every sale. But here's the uncomfortable truth: revenue doesn't pay the bills. Profit does. And most e-commerce operators are flying blind on the metrics that actually determine whether they're building a business or just renting customers from Meta.
The $1M Revenue Trap: Stores doing $1M in revenue often pocket less than $100K after COGS, ads, shipping, and returns. The difference between thriving and surviving isn't selling more—it's knowing where profit hides.
1. Contribution Margin by Product
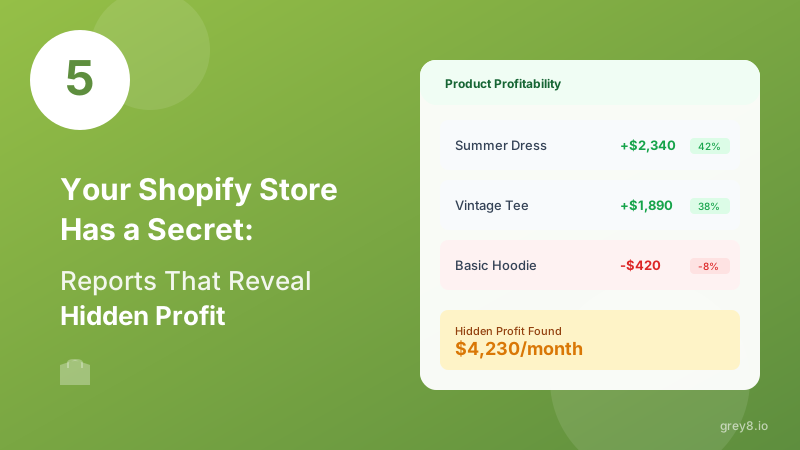
Not all revenue is created equal. Your best-selling product might be your least profitable one. Contribution margin reveals the truth: after COGS, shipping, payment fees, and ad spend, what's actually left?
Shopify shows you gross sales. Grey8 shows you which products actually fund your growth. Many store owners discover their hero product is subsidizing unprofitable SKUs they thought were winners.
2. Customer Acquisition Cost by Channel
You're spending $50 to acquire a customer on Meta. Your email flows bring them back for $2. But Shopify's native analytics don't connect acquisition cost to channel-specific LTV—so you can't see which channels are actually profitable.
Grey8 Advantage: Connect your ad platforms and Shopify, and Grey8 automatically calculates true CAC and payback period by channel, campaign, and customer cohort. No more guessing which ads actually work.
The most profitable e-commerce stores don't just track ROAS—they track contribution margin per channel. A 3X ROAS sounds great until you realize 30% margins mean you're breaking even.
3. Repeat Purchase Rate by Cohort
First-time customers are expensive. Repeat customers are profitable. Your repeat purchase rate reveals whether you're building a brand or just a transaction engine.
Target: 27%+ of customers should buy again within 90 days. Below 20%? Your product-market fit or post-purchase experience needs work. Track this by acquisition cohort—customers from different channels have wildly different repeat rates.
Pro Tip: Your best customers buy 3+ times. Identify what the 3X buyers have in common (product, channel, discount exposure) and optimize for that profile.
4. Return Rate by Product & SKU
Returns are the silent killer of e-commerce profit. Every return costs you 2-3X: the refunded revenue, the reverse shipping, the damaged inventory, and the lost opportunity cost.
Industry average: 20-30% return rate for apparel, 5-15% for other categories. But averages lie. One SKU with a 40% return rate can tank your entire margin. Shopify doesn't automatically flag this—you have to dig into order data and refund patterns manually.
Grey8 surfaces high-return SKUs automatically and calculates the true cost impact including logistics. Most store owners discover 10-15% of SKUs generate 60%+ of returns.
5. Inventory Turnover Rate
Cash sitting in inventory is cash that isn't funding growth. Your inventory turnover rate reveals whether you're efficiently converting stock to sales—or building a warehouse of slow-moving liabilities.
Target: 4-6X annual turnover for most categories (selling through your average inventory every 60-90 days). Below 3X? You're overstocked or carrying dead SKUs. Above 8X? You might be under-ordering and missing sales.
Cash Flow Reality: $100K in slow-moving inventory costs you $10K+ annually in opportunity cost (assuming 10% cost of capital). Know which products tie up cash vs. which ones fly off shelves.
From Revenue Theater to Real Profit
Most Shopify merchants obsess over daily sales notifications. The profitable ones obsess over these five metrics. The difference? One group celebrates revenue. The other banks profit.
Calculating these manually requires exporting Shopify data, combining it with ad platform spend, and building complex spreadsheets. Or you could connect Grey8 and see all five metrics update in real-time.
Revenue is vanity. Profit is sanity. Grey8 helps you find yours.