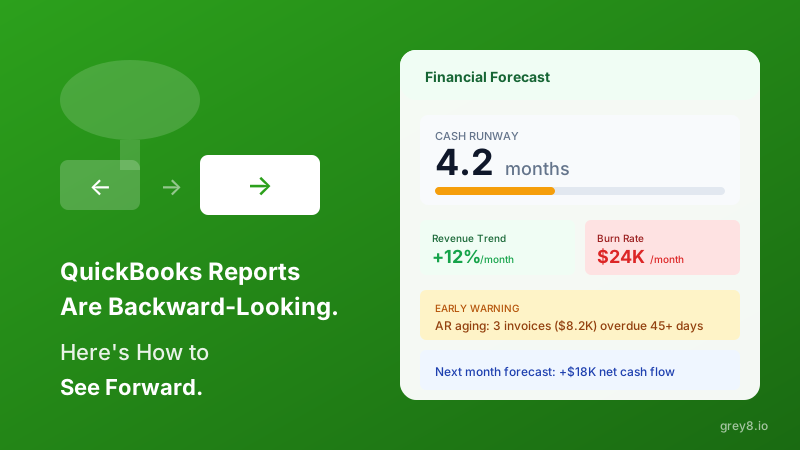
Your QuickBooks dashboard shows last month's profit. Congratulations—you already spent that money three weeks ago. What you need to know is whether you'll have cash to make payroll in 45 days. QuickBooks can't tell you that. But your data can.
The Blind Spot: 82% of small businesses that fail cite cash flow problems as the cause. Yet most check QuickBooks once a month, looking at historical reports. By the time you see the problem, it's too late to fix it.
1. Cash Runway Forecast
Cash runway is simple: how many months until you run out of money at your current burn rate? If you have $50K in the bank and spend $10K more than you earn each month, you have 5 months of runway. Less if you have irregular expenses coming.
QuickBooks shows your bank balance, but calculating runway requires trend analysis of cash flow over multiple periods, accounting for seasonality, upcoming large expenses, and revenue growth or decline. Manual spreadsheet work—or automated with Grey8.
Grey8 Advantage: We analyze your historical cash flow from QuickBooks, identify trends, and project your runway forward with 90-day accuracy. You get alerts when runway drops below your threshold.
2. Revenue Growth Rate vs Expense Growth Rate
Revenue up 10% year-over-year sounds great. Until you realize expenses are up 15%. You're growing yourself out of business—each new customer makes you less profitable than the last. This is the classic scale trap.
QuickBooks' P&L shows both numbers, but seeing them separately misses the critical relationship. You need to track the delta: is the gap between revenue growth and expense growth widening or narrowing?
The Warning Sign: Revenue growth slowing while expense growth accelerates. This pattern precedes cash flow crises by 60-90 days. Catch it early and you can cut costs before you're forced to.
Grey8 automatically calculates month-over-month and year-over-year growth rates for revenue and expenses, plots them together, and alerts you when the gap moves in the wrong direction. You see trajectory, not just current state.
3. AR Aging Forecast (Not Just Current)
Your Accounts Receivable aging report shows $30K outstanding over 60 days. That's bad. But what it doesn't show: based on historical collection patterns, $18K of that is probably uncollectible. Your actual cash position is $18K worse than your books suggest.
Standard AR aging is a snapshot. Predictive AR aging uses historical collection rates by customer, by age bucket, and by seasonal patterns to estimate actual cash collection—not just what's theoretically owed.
Grey8 analyzes your payment history by customer and aging bucket, calculates collection probability, and adjusts your cash forecast accordingly. You plan based on realistic collections, not optimistic invoices.
4. Seasonal Cash Flow Patterns
You're a B2B service company. Every December your revenue drops 40% because clients slow spending before year-end. Every January you scramble to cover payroll. This happens every year—but you're always surprised because QuickBooks doesn't warn you.
Historical seasonality is predictable. You just need to see it across multiple years and project it forward. QuickBooks shows you this year versus last year. What you need is this year versus the three-year average, adjusted for growth.
Pro Tip: Overlay your seasonal revenue patterns with your fixed expenses. The months where the curves diverge most are your cash flow risk periods. Build reserves ahead of them.
Grey8 identifies your seasonal patterns automatically, overlays them with your expense schedule, and projects forward to show you which months will have cash crunches. You can plan for them instead of reacting to them.
5. Vendor Payment Optimization
You have $25K in bills due. $10K has a 2% early payment discount if paid in 10 days. $15K has net-30 terms with no penalty for paying on day 29. What's the optimal payment schedule to maximize your cash position?
Most businesses either pay everything early (to avoid late fees) or pay everything late (to conserve cash). Neither is optimal. The right answer depends on your current cash, upcoming receivables, discount terms, and cost of capital.
Grey8 analyzes your AP aging, identifies early payment discounts, calculates the ROI of taking them versus preserving cash, and recommends an optimized payment schedule based on your cash forecast. Small optimization, significant impact over time.
From Historical Reports to Predictive Finance
QuickBooks is a brilliant accounting system. It records transactions with precision, generates accurate reports, and handles compliance requirements. But it's fundamentally backward-looking—designed to tell you what happened, not what's about to happen.
As a business operator, what happened last month is context. What matters is what's coming next quarter. And that requires turning historical QuickBooks data into forward-looking forecasts:
- Cash runway projections based on burn rate trends
- Revenue vs expense growth delta tracking
- AR aging weighted by historical collection probability
- Seasonal pattern recognition and forward projection
- Vendor payment optimization based on cash position
These aren't complex financial engineering. They're basic operational metrics that every CFO tracks—but most small businesses can't afford a CFO. So they fly blind, making decisions on last month's data.
Grey8 connects to your QuickBooks and calculates all of these forward-looking metrics automatically. No spreadsheets. No financial modeling expertise required. Just predictive insights from the data you already have.
Stop looking in the rearview mirror. Start seeing around corners.