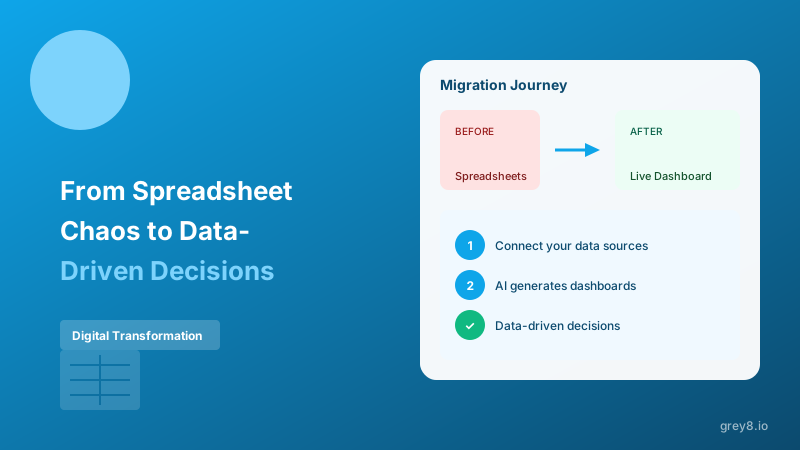
Every growing business hits the spreadsheet wall. What started as a simple revenue tracker is now 15 interconnected Excel files, each with its own version history, manual updates, and a single person who knows how the formulas work.
The Inflection Point: When your team spends more time updating spreadsheets than analyzing the insights, you've crossed the threshold. The tools that got you to $1M won't get you to $10M.
Signs You've Outgrown Spreadsheets
Not everyone needs to migrate. Spreadsheets are powerful tools—until they're not. Here are the warning signs:
1. Version Control Chaos: You have "Revenue_Report_v3_FINAL_ACTUALLY_FINAL.xlsx" and nobody knows which version is current.
2. Manual Data Entry: Someone spends 4+ hours every Monday copying data from Stripe, QuickBooks, Google Ads, and Facebook Ads into a master spreadsheet.
3. Formula Fragility: One wrong click deletes a formula, and your entire month's reporting is broken. Only one person knows how to fix it.
4. Analysis Lag: It takes 3 days to answer "Why did revenue drop last week?" because you need to rebuild the report from scratch.
5. Collaboration Bottlenecks: Your CFO and marketing lead can't look at the same data simultaneously without breaking formulas or creating conflicts.
6. Growing Data Volume: Your Excel file takes 30 seconds to open and crashes when you try to add a pivot table on 50,000 rows.
The Tipping Point: If three or more of these describe your business, migration isn't optional—it's urgent. Every week of delay is compounding inefficiency.
The Migration Spectrum
Migration doesn't mean all-or-nothing. There's a spectrum of solutions, and you should choose based on your complexity, budget, and technical capability:
Level 1: Connected Spreadsheets - If you have less than 10,000 rows of data and simple analysis needs, Google Sheets with automated data pulls might be enough. Tools like Coefficient or Supermetrics can sync your data sources to Sheets automatically. This is a $50-200/month solution.
Level 2: No-Code BI Tools - For most small to mid-sized businesses, this is the sweet spot. Looker Studio (free), Metabase (free self-hosted or $85/month cloud), or Tableau gives you real dashboards without requiring engineering. This is a $100-500/month solution.
Level 3: Custom Platforms - When you have complex data from 10+ sources, need real-time updates, or want AI-powered insights, purpose-built platforms make sense. This is a $500-2000/month solution but eliminates the most technical work.
Step 1: Audit and Consolidate
Before you migrate anything, you need to understand what you actually have. Most businesses discover they have 3-5x more spreadsheets than they thought.
The Spreadsheet Audit:
• Inventory every business-critical spreadsheet
• Identify who owns each one
• Document what data sources feed into it
• Note how often it's updated (daily, weekly, monthly)
• List who consumes the insights
Common Discovery: Most teams find that 40% of their spreadsheets are duplicates—different people solving the same problem independently. Consolidation alone can save 10+ hours per week.
The Consolidation Phase:
• Identify overlapping spreadsheets and merge them
• Archive historical versions that nobody uses
• Create a "source of truth" hierarchy (which spreadsheet wins when numbers conflict?)
• Document dependencies (Spreadsheet A feeds into Spreadsheet B)
Don't skip this step. Migrating chaos to a dashboard just creates an automated mess.
Step 2: Establish Single Sources of Truth
Spreadsheet chaos often stems from multiple copies of the same data. Revenue lives in QuickBooks, Stripe, your CRM, and three different Excel files—each with slightly different numbers.
Define your source of truth for each data type:
• Revenue: Stripe (payment processor) is truth, not manual accounting entries
• Customers: CRM (HubSpot, Salesforce) is truth, not spreadsheet lists
• Marketing spend: Ad platforms (Facebook, Google) are truth, not expense reports
• Inventory: Your e-commerce platform or 3PL is truth
Once you define sources of truth, stop manually copying data. That's what automation is for.
Pro Tip: For every metric in your dashboard, document the source system and calculation logic. When numbers don't match expectations, this documentation is worth its weight in gold.
Step 3: Automate Data Feeds
Manual data entry is the enemy of scalability. If a human is copying numbers from one system to another, that's a process waiting to be automated.
The Automation Stack:
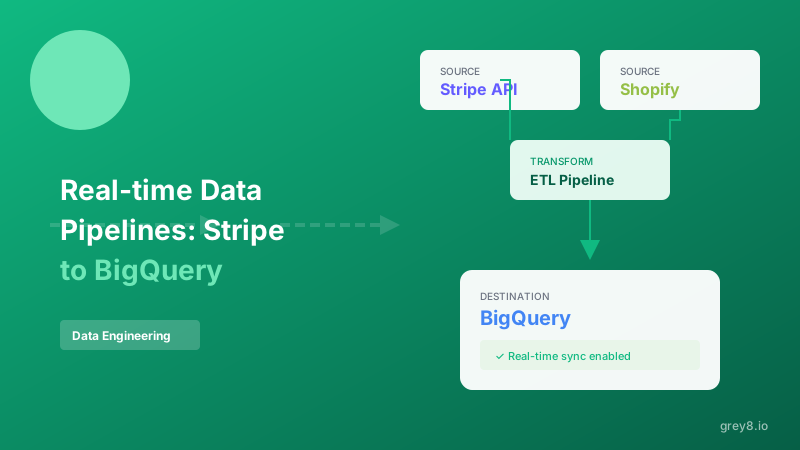
• ETL Tools: Fivetran, Airbyte, or Stitch copy data from sources (Stripe, QuickBooks) to a destination (Google Sheets, BigQuery, Snowflake)
• No-Code Connectors: Zapier or Make.com for simple workflows ("when a Stripe payment succeeds, add a row to Google Sheets")
• Native Integrations: Many BI tools have built-in connectors to common platforms
Start with your highest-volume, most error-prone manual process. If someone spends 4 hours every Monday copying Stripe data, automate that first.
The ROI Math: If automation costs $200/month and saves 10 hours of manual work at $50/hour, it pays for itself immediately and saves $300/month thereafter.
Step 4: Build Dashboards Incrementally
Don't try to recreate all 15 spreadsheets as dashboards in week one. You'll burn out and likely build things nobody uses.
The Incremental Approach:
Week 1-2: Critical Metrics Only
Build a single dashboard with the 5-10 metrics your team checks daily:
• Revenue (daily, weekly, monthly)
• Customer acquisition
• Top-line growth rate
• Key operational metrics (depends on your business)
Week 3-4: Department-Specific Dashboards
• Marketing: CAC, ROAS, conversion rates by channel
• Finance: Cash flow, burn rate, runway
• Operations: Inventory levels, fulfillment times, customer support metrics
Month 2-3: Advanced Analytics
• Cohort analysis
• Attribution modeling
• Predictive forecasting
User Adoption Key: If people are still checking old spreadsheets instead of new dashboards, your dashboards don't answer the right questions. Watch actual behavior, not stated preferences.
Dashboard Design Principles:
• One dashboard per decision-maker or team
• Most important metric at the top (what you'd check on your phone)
• Trend over time > single point-in-time number
• Color-code for status (green = good, red = needs attention)
• Link to drill-down views for investigation
Step 5: Iterate Based on Usage
Your first dashboards won't be perfect. That's fine. Launch them, watch how people use them, and iterate.
Track Usage Metrics:
• Which dashboards get viewed daily vs weekly vs never?
• Where do people click for drill-downs?
• What questions still require spreadsheet analysis?
• What metrics generate the most discussion in meetings?
Double down on high-usage dashboards. Retire low-usage ones. Add drill-down capabilities where people keep asking "why?"
Anti-Pattern: Building 20 dashboards that nobody looks at because they're not answering business questions. Better to have 3 dashboards that get checked daily than 20 that gather dust.
The Feedback Loop:
• Weekly check-ins: "What questions couldn't you answer this week?"
• Monthly reviews: "Which dashboards did you actually use?"
• Quarterly planning: "What new metrics do we need for next quarter's goals?"
Step 6: Expand and Optimize
Once your core dashboards are stable and actually used, you can expand to more sophisticated use cases:
Advanced Features to Add:
• Automated anomaly detection and alerts
• Predictive analytics and forecasting
• Custom segmentation and cohort analysis
• Multi-touch attribution for marketing
• Executive rollup dashboards
But only add these when you have the basics nailed. Fancy analytics on top of broken data is just expensive garbage.
Step 7: Know When to Get Help
You can DIY this migration if you have technical resources and time. But most businesses underestimate the effort required.
Get help if:
• You have more than 5 data sources to integrate
• Your team doesn't have experience with ETL or data modeling
• You need results in weeks, not months
• Your data quality is questionable and needs cleaning
• You want best practices from day one, not trial-and-error
ROI Reality Check: A consultant might cost $5,000-15,000 for migration, but they'll deliver in 4-6 weeks what would take your team 6+ months of part-time work. The opportunity cost of delayed insights often exceeds the consulting cost.
What to Expect from Professional Help:
• Data source audit and consolidation
• ETL pipeline setup and testing
• Dashboard design and implementation
• Team training and documentation
• 30-60 days of post-launch support
The Bottom Line
Migrating from spreadsheets to dashboards isn't about technology—it's about changing how your business makes decisions.
Spreadsheets force you to ask questions you already know to ask. Dashboards surface insights you didn't know to look for.
Spreadsheets are retrospective. Dashboards are proactive.
Spreadsheets scale linearly with effort. Dashboards scale exponentially with insight.
The migration is disruptive in the short term. But the alternative—staying stuck in spreadsheet chaos as your business grows—is far more painful.
Start small. Automate one manual process this week. Build one dashboard this month. By quarter-end, you'll wonder how you ever ran a business on spreadsheets alone.