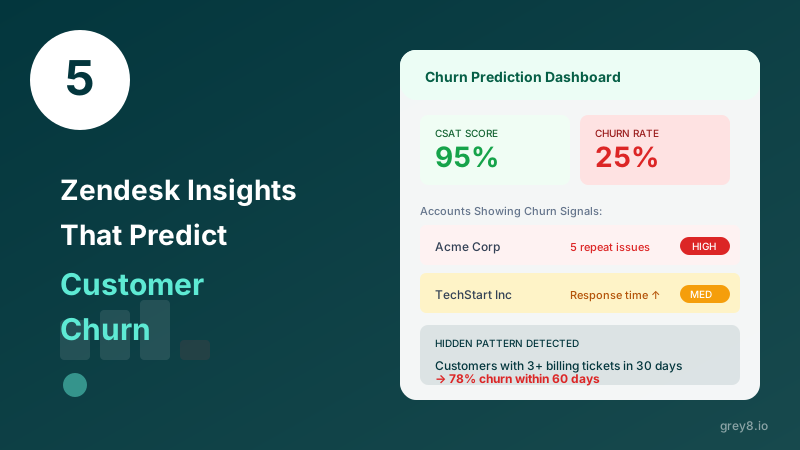
Your support team celebrates high CSAT scores and low resolution times. Meanwhile, customers are quietly canceling their subscriptions. The disconnect isn't your team's fault—it's that Zendesk's default metrics measure operational efficiency, not customer health.
The Uncomfortable Truth: A customer can leave a 5-star satisfaction rating on their support ticket and still churn 30 days later. Ticket closure doesn't equal customer retention.
1. Repeat Contact Rate
When a customer contacts support multiple times about the same issue—or related issues in the same category—they're not just frustrated. They're evaluating alternatives.
Zendesk tracks whether a ticket is marked "solved," but it doesn't automatically flag when the same customer submits a new ticket within 7 days about a similar problem. That pattern is a leading indicator of churn.
Grey8 analyzes ticket history by customer and automatically calculates repeat contact rate by issue category, so you can identify which product areas are eroding trust.
2. Topic Clustering Analysis
Your support team uses tags. But are they consistent? And more importantly—what patterns emerge when you group tickets by actual semantic content instead of manually-applied labels?
Grey8 Advantage: AI-powered topic clustering automatically groups Zendesk tickets by theme, revealing hidden patterns that human tagging misses—like "login issues" that are actually "password reset flow confusion."
When one topic cluster suddenly spikes, you're seeing a product problem in real-time—often before your product team knows it exists. Customers experiencing those emerging issues are 3x more likely to churn within 60 days.
3. Sentiment Trajectory Over Time
A single angry ticket doesn't predict churn. But a customer whose sentiment degrades across multiple interactions? That's a relationship in freefall.
Zendesk's CSAT asks customers how they felt about one interaction. Sentiment trajectory asks: how is this customer's overall experience trending? From optimistic early adopter to frustrated power user to silent detractor—you can see the arc before they leave.
Pro Tip: Customers who go from positive to neutral sentiment are actually higher churn risk than customers who start negative. Declining enthusiasm is harder to reverse than solving a specific problem.
4. First Response Time vs. Resolution Satisfaction
Standard Zendesk reports show average first response time. But here's what matters more: the correlation between how quickly you respond and whether the customer is satisfied with the outcome.
Some issues require speed—login problems, payment failures, outages. Respond in under 15 minutes and satisfaction soars. Other issues—feature requests, workflow questions—don't penalize slower response times, but demand higher-quality answers.
Treating all tickets the same means you're over-investing in low-stakes speed and under-investing in high-stakes clarity. Grey8 automatically segments tickets by urgency type and shows you where response time actually moves satisfaction—and where it doesn't.
5. Escalation Patterns and Ownership Transfers
Every time a ticket gets reassigned to a different agent or escalated to a specialist, the customer's confidence drops. Not because escalation is inherently bad—but because each handoff introduces friction, delays, and the need to re-explain the problem.
Customers whose tickets are escalated 2+ times have a 40% higher churn rate than customers whose issues are resolved by the first responder. This metric is invisible in Zendesk's standard reporting because it requires joining ticket assignment history with customer retention data.
From Reactive to Predictive Support
These five metrics transform your Zendesk data from a record of what happened into a prediction system for who's about to leave. But calculating them manually means exporting ticket data, joining it with CRM records, and running statistical analysis in Python or R.
Grey8 connects to Zendesk in 60 seconds and calculates all five churn indicators automatically—updated in real-time, with drill-down by customer segment, product tier, and support channel. No data exports. No SQL queries. Just answers.
Because the best time to save a customer is before they start looking for alternatives.