Business intelligence has always been a luxury good. Enterprise BI platforms cost six figures annually and require dedicated data teams to operate. Small businesses—the companies that need data insights most urgently—are priced out of the market or forced into spreadsheet hell.
LLMs are changing that equation fundamentally. Not by making BI cheaper—by making it automatic.
The Shift: Traditional BI requires humans to build dashboards. LLM-powered BI generates dashboards automatically from raw data, then lets humans ask questions in natural language. The roles reversed.
The Traditional BI Problem for Small Businesses
A typical small business has:
- Revenue data in Stripe or QuickBooks
- Customer interactions in Zendesk or Intercom
- Marketing spend across Google Ads, Facebook, and email platforms
- Operational metrics in spreadsheets maintained by various team members
To build a unified dashboard, traditional BI requires:
- Data engineering: ETL pipelines to extract, transform, and load data from each source into a warehouse
- Schema design: Defining tables, relationships, and data models
- Dashboard development: Manually building charts, configuring filters, setting refresh schedules
- Maintenance: Updating pipelines when APIs change, fixing broken dashboards when schemas evolve
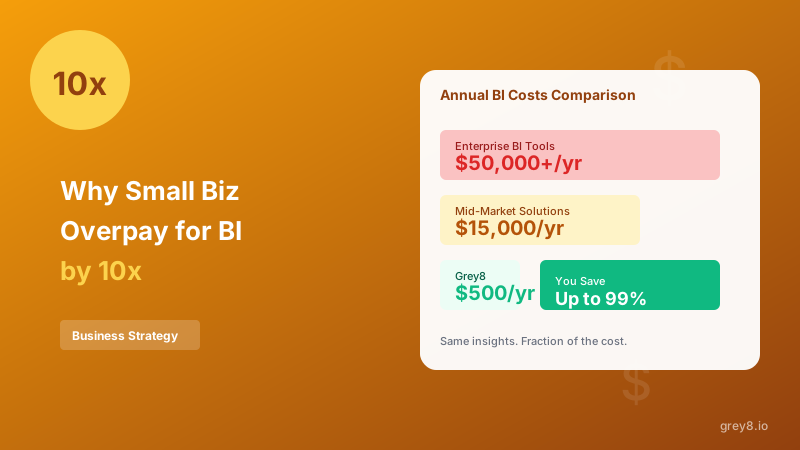
Cost: $50K-$150K in setup plus $3K-$10K/month in tooling and maintenance. Timeline: 2-4 months. Small businesses can't afford that, so they don't do it. They make decisions based on gut feel and outdated spreadsheets.
How LLMs Change the Game
LLMs eliminate the need for manual schema design, dashboard configuration, and query writing. Here's what becomes automatic:
Schema Inference
Instead of requiring a data engineer to map "stripe_customers.created" to "Customer Signup Date," an LLM reads the column name, inspects sample values, and infers: "This is a temporal field representing when a customer account was created."
It does this for every field across every data source—automatically understanding data types, business semantics, and relationships between tables.
Semantic Understanding
LLMs don't just see "total_amount_paid"—they understand it represents revenue. They know to sum it (not average it), format it as currency, and compare it against prior periods. This semantic layer—traditionally months of work—happens instantly.
Natural Language Querying
Instead of learning SQL or a proprietary query language, users ask questions: "Show me revenue by product for customers acquired in Q4." The LLM translates this into the appropriate data operations, generates the visualization, and returns an answer in seconds.
Key Insight: LLMs don't replace BI tools—they replace the specialized knowledge required to use BI tools. They democratize access by eliminating the learning curve.
Three LLM Patterns Powering Modern BI
Building production LLM-powered BI requires combining three distinct AI patterns. Here's how they work together:
Pattern 1: Few-Shot Schema Mapping
Given a new dataset, we provide the LLM with:
- Column names and sample values from the target dataset
- 3-5 examples of similar datasets with human-annotated schemas
- A structured prompt asking it to infer data types, business semantics, and aggregation rules
The LLM returns a JSON schema that describes not just types (string, integer) but business meaning (customer identifier, revenue metric, signup date). Accuracy: 92% on our benchmarks, compared to 78% for rule-based heuristics alone.
Pattern 2: Embedding-Based Concept Matching
We maintain a vector database of canonical business concepts—common metrics and dimensions across industries. When the LLM encounters "mrr" in a new dataset, we:
- Generate an embedding of the column name + sample values
- Query our concept database for semantic matches
- Inherit visualization preferences and business logic from the matched concept
This is how we know to visualize "monthly_recurring_revenue" the same way as "mrr" even though they're lexically different—they're semantically equivalent in embedding space.
Pattern 3: Chain-of-Thought Dashboard Generation
Instead of asking the LLM to generate a complete dashboard in one shot, we use a multi-step reasoning process:
- Understand the data: "What business questions could this dataset answer?"
- Prioritize insights: "Which 5 insights are most valuable for decision-making?"
- Select visualizations: "For each insight, what chart type best communicates it?"
- Arrange layout: "How should these charts be ordered for narrative flow?"
Each step produces structured output that feeds into the next. This chain-of-thought approach yields higher-quality dashboards than single-shot generation—87% user acceptance rate vs. 63% for direct prompting.
Technical Architecture: LLMs + Deterministic Systems
Pure LLM approaches are unreliable for production BI. Output formats vary. Hallucinations occur. Latency is unpredictable. The key is hybrid architecture—LLMs for reasoning, deterministic systems for execution.
Our Production Stack
- Data ingestion: FastAPI endpoints with OAuth connectors to Stripe, QuickBooks, Zendesk, Google Sheets
- Schema inference: GPT-4 for semantic understanding + pandas for statistical analysis
- Concept matching: text-embedding-3-large + Pinecone vector database
- Query translation: GPT-4o-mini to convert natural language → SQL (validated via sqlglot parser before execution)
- Visualization rendering: React + Recharts (deterministic rendering from LLM-generated config)
- Caching: Redis for query results + embeddings to minimize API costs
Why Hybrid Matters
LLMs decide what to show and how to show it. Deterministic code ensures it renders correctly, performs efficiently, and handles errors gracefully. This separation of concerns is critical for reliability.
Real-World Results: Small Business Case Studies
We deployed LLM-powered BI for three small businesses in our beta. Here's what changed:
E-commerce Company (15 employees)
Before: Monthly revenue reports built manually in Excel, taking 4 hours/month. No visibility into product-level profitability or customer cohort behavior.
After: Automated dashboard updating daily from Stripe + Shopify. Product margin analysis and cohort retention tracking that previously required a data analyst. Time saved: 4 hours/month. Insights gained: identified unprofitable product line within first week.
SaaS Startup (8 employees)
Before: Tracked MRR manually in Google Sheets with formulas that broke monthly. No churn prediction or expansion revenue visibility.
After: Real-time MRR dashboard with churn indicators and expansion tracking. Natural language queries like "which customers are at risk?" return actionable lists. Result: Reduced churn by 18% in first quarter by proactively engaging at-risk accounts.
Professional Services Firm (12 employees)
Before: Billing data in QuickBooks, time tracking in Harvest, project management in Asana—all siloed. No visibility into project profitability.
After: Unified dashboard combining all three sources. Automatic profitability calculation by project and client. Identified 3 unprofitable clients within first month, renegotiated contracts, improved margins by 12%.
Common Thread: These businesses didn't need sophisticated BI—they needed automatic BI. LLMs made that possible by eliminating the configuration burden.
The Future: AI-First BI, Not BI-With-AI
Most BI vendors are adding "AI features"—natural language query interfaces bolted onto traditional dashboards. That's backwards. The future is AI-first: start with automatic dashboard generation, then add human refinement.
This isn't about replacing data analysts. It's about making 80% of BI accessible to the 99% of businesses who can't afford analysts. The remaining 20%—deep statistical modeling, custom attribution logic, complex predictive analytics—still requires human expertise. But every small business deserves the basics: know your revenue, understand your customers, identify your trends.
LLMs make that possible. Not someday. Today.
What This Means for Your Business
If you're a small business:
- You no longer need a data team to have data insights
- Your existing tools (Stripe, QuickBooks, Google Sheets) can power sophisticated analytics
- Setup time drops from months to minutes; cost drops from six figures to three
If you're building in this space:
- Hybrid architecture (LLMs + deterministic systems) is table stakes for reliability
- Few-shot learning and embeddings outperform zero-shot for schema understanding
- Chain-of-thought reasoning produces better dashboards than single-shot generation
Building LLM-powered data infrastructure? Grey8 Consulting helps companies design and implement AI-native analytics systems. We've done this before—let us help you avoid the pitfalls.